investments

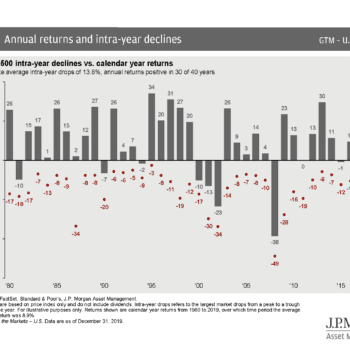
A chart titled "Annual returns and intra-year declines" illustrates the S&P 500 intra-year stock index declines and annual calendar year returns from 1980 to 2019. Red dots represent the largest intra-year declines, with noteworthy fluctuations, including periods like the Covid-19 financial market impact.

COVID-19 Financial Market Update

Volatility is the word when you consider the Covid-19 Financial Market. The coronavirus (COVID-19) scare is escalating and a logical question has moved to the forefront: Is this downswing different? Is coronavirus going to permanently bring down markets in a way those past crises could not? The historic litany of disease outbreaks, armed conflict flashpoints, political game-changers, and other alarms all generated fear of the unknown. However, the nature of markets allows them to still

Read More »
A close-up illustration depicts a green coronavirus particle with its distinctive protein spikes against a dark background. The virus appears spherical, showcasing multiple protruding spike proteins. Another coronavirus particle is seen in the blurred background, floating in the dark space.

Coronavirus, the Stock Market, and Your Portfolio

Coronavirus is a new type of disease spreading from person to person. Although it’s currently unknown how easily or sustainably this virus is moving between people. Investment markets recently experienced increased volatility, with positive and negative fluctuations often linked to the status of the Coronavirus outbreak. Stock market volatility increased after cases grew in Italy, Iran, and South Korea.  Investors have become concerned that the disease has spread many miles from its Wuhan, China origination

Read More »

How can we help?

This field is for validation purposes and should be left unchanged.